A higher resolution label is the advice many teams still follow, and it is the advice that fails first. Two exports can both say 1080p, look interchangeable on a laptop, and then trade places on a phone. Buffering, late captions, and a bitrate that cannot hold the picture will beat pixel count every time.
A video quality comparison that holds up in production treats stability, captions, and the actual viewing device as part of quality. Sharpness is one input. It is not the verdict.
What a Video Quality Comparison Really Measures
Two files both labeled 1080p get ranked by eye on one laptop, and the ranking flips on a phone. The laptop shows blocking in a dark gradient. The phone hides that block and makes motion smear the thing people notice. That flip is the usual starting mistake.
A real comparison is a controlled test. The same source is encoded in more than one way, and every version is judged under the same conditions. Subjective scores and computational metrics can sit side by side, but only if the sheet says how each number was made.
Mean Opinion Score (MOS) is the term that keeps those two kinds of scores from being mixed up. ITU-T Recommendation P.800.1, published in 2016, standardized MOS terminology for audio, video, and audiovisual quality. MOS is typically the arithmetic mean of viewers' judgments on a five-point quality scale. The recommendation also separates subjective video MOS from objective or estimated MOS, so a report can say whether people scored the clip or a model did.
Device context changes the number. ITU-T guidance emphasizes that MOS depends on display resolution, screen size, viewing device, and application, so a UHD television result cannot be treated as the same result on a mobile phone. Bitrate, sharpness, compression artifacts, motion, and viewing context can reorder two files even when their objective measurements look close. Social, web, and mobile playback all do this.
Five details every sheet needs
- Playback device: phone, laptop, or television, named in the row.
- Resolution: the encoded size, not the badge on the master.
- Test conditions: viewing distance, local playback or stream, and the room if it affects the picture.
- Scoring scale: five-point MOS, or the metric scale you computed.
- Score source: viewers, or a predictive model.
Practical rule: A comparison without these five details is an opinion, not a measurement.
PSNR, SSIM, VMAF and MOS Compared
| Metric | What It Measures | Scale | Strength and Limit |
|---|---|---|---|
| PSNR | Pixel-level error between the encoded frame and the reference | Decibels, higher is better | Fast and simple; can rank files that look different to viewers |
| SSIM | Structural similarity of luminance, contrast and structure | 0 to 1, higher is better | Closer to perception than PSNR; still a reference-based proxy |
| VMAF | Learned model of perceived quality from detail, contrast, motion and structure | 0 to 100, higher is better | Strong correlation with viewers; needs a pristine reference and the right model for the display |
| Subjective MOS | Average of viewer ratings on a five-point scale | 1 to 5, higher is better | Closest to the audience; slow and costly to run at scale |
PSNR is a pixel error score in decibels. It is quick to compute and useful as a smoke test after an encode. It will happily prefer a file that people dislike, because a small average error can still sit on a face, a subtitle, or a flat wall.
SSIM compares luminance, contrast, and structure, on a scale from 0 to 1. It tracks perception better than raw pixel error. It is still a proxy against a reference frame, and a high structural score can coexist with flicker that only shows up across time.
VMAF is the score I would use to rank encodes. Netflix's VMAF project describes a learned model that fuses detail preservation, contrast, motion, and structural information into a 0 to 100 score, with higher meaning better perceived quality. Compare candidates against the same pristine reference at the same resolution, frame rate, color format, and playback conditions. Report the mean together with the 5th-percentile or per-scene score. An average hides failures on subtitles, faces, rapid motion, and dark gradients.
Model choice is part of the test. Netflix ships separate models for 1080p HDTV, mobile, and 4K. A model trained for one display should not rank content meant for another. VMAF is full-reference, so it cannot tell you that an AI scene is semantically right when no pristine source exists. For that gap, methods for assessing video quality for deepfake detection are a useful companion read, because fidelity to a reference and "does this face stay a face" are different questions.
What a correlation does not replace
Objective scores can track people closely. In one UHD comparison published with ITU-T tutorial material on P.1204, reported correlations with viewer MOS were 0.936 for J.342 and 0.895 for VMAF. That is strong tracking. It is not a substitute for controlled viewing across devices, codecs, and bitrates.
Rank with mean VMAF plus the worst-scene score. Keep subjective MOS for the decision you cannot take back.
I would not accept an encode on the mean alone. Set a floor on the worst scene, then let a short human pass decide lip-sync, text, faces, and temporal artifacts.
How to Run a Fair Side-by-Side Test
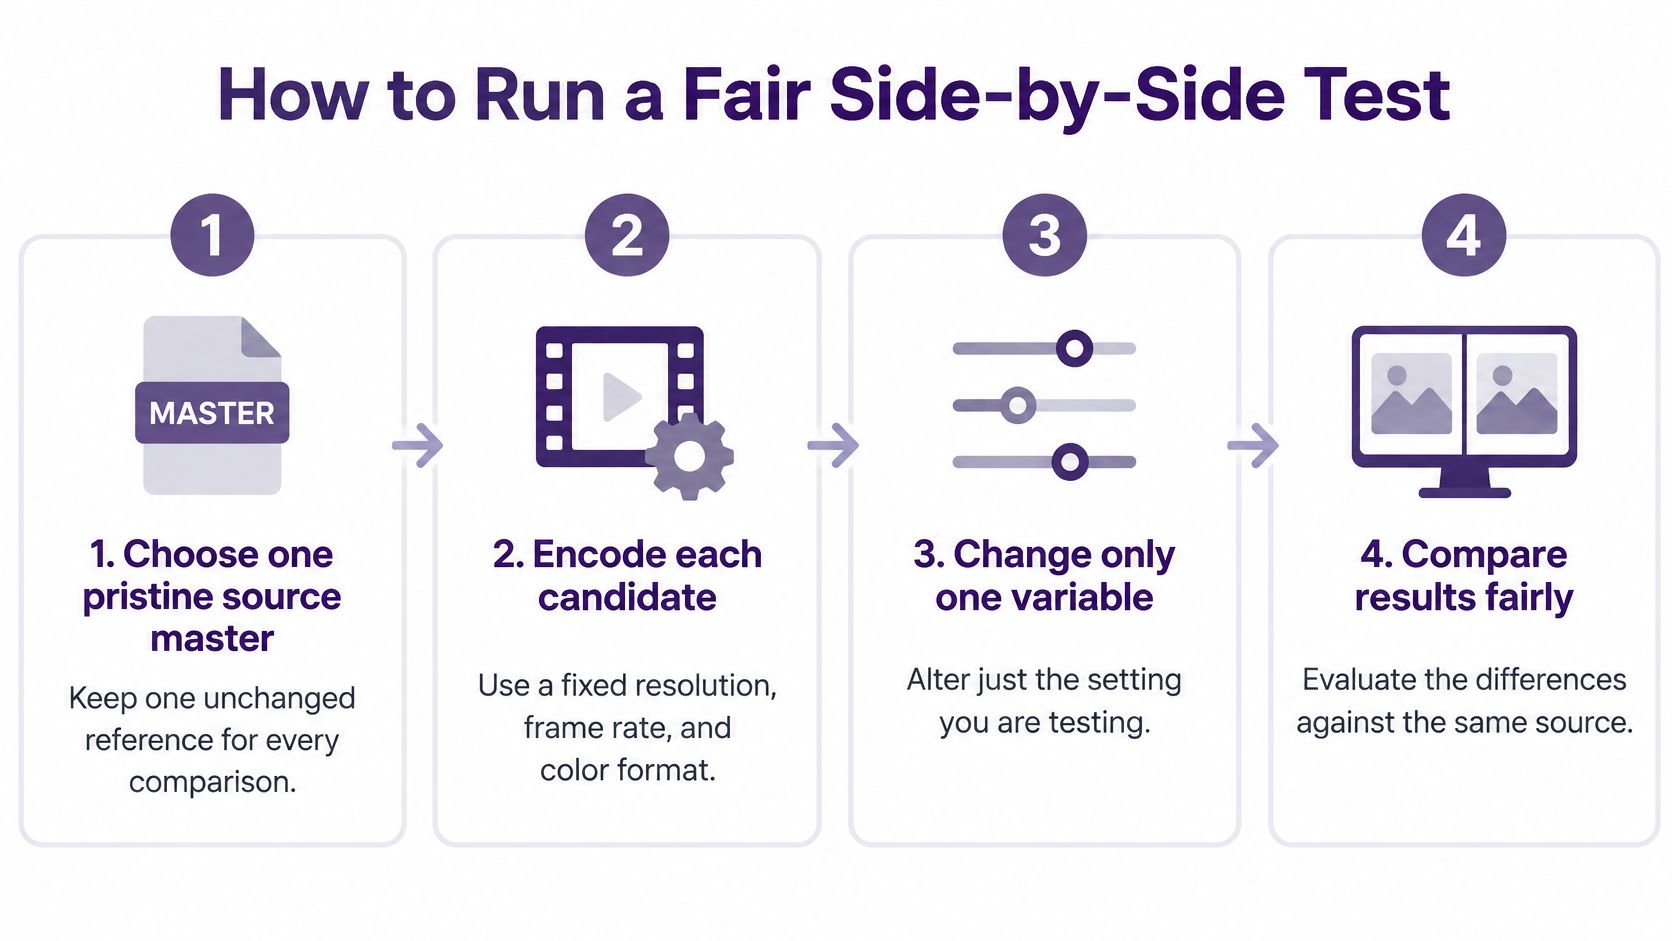
A ranking only travels if a second person can rebuild it. Lock the source, change one variable, and write the conditions into every row.
The seven steps
- Keep one pristine master. Store it unchanged. Every candidate is judged against that file, so a quiet regrade or a cropped recut does not sneak into the test.
- Fix resolution, frame rate, and color format. If you are testing a codec, do not also change 1080p to 4K. If you are testing frame rate, do not also change the color format. One variable, or the sheet lies.
- Play every file on the same device and the same screen size. Scores move when the display moves. A television pass and a phone pass are two tests, not one test with two opinions.
- Score VMAF as mean and worst scene. Add PSNR or SSIM only as supporting numbers. If the mean is high and one scene collapses, the collapse is the result.
- Run a blind side-by-side panel. A workable start is at least 15 viewers, each scoring on the five-point scale, without being told which file is "the new encode." Names and job titles bias people.
- Test delivery, which is the step many skip. Netflix's speed guidance lists at least 3 Mbps for 720p HD, 5 Mbps for 1080p Full HD, and 15 Mbps for 4K Ultra HD. Stream each file at those sustained speeds on the same display. Log the resolution the player selected, startup delay, and any rebuffering. If bandwidth falls short, adaptive streaming picks a lower representation, and the master you were proud of never reaches the screen.
- Record codec, profile, container, bitrate mode, and the source master on every row. "HD" and "4K" are labels. The row is the measurement.
What you should be holding at the end
One comparison sheet, same columns, same conditions, one variable moving down the page. A colleague should be able to replay the files and land on the same order without asking you what you meant.
If step 6 is missing, you have a lab ranking. You do not yet have a publish ranking. Bandwidth, device decode, display size, and whether the picture stays up are part of the delivered experience, not a separate project.
Codec and Bitrate Trade-offs at Equal Quality
Compare codecs at equal perceived quality, not at equal bitrate and not at equal resolution. A smaller file at a worse picture is not a saving. A larger file that people cannot tell apart from a leaner one is waste.
| Codec | Bitrate Versus H.264 at Equal VMAF | Illustrative Crossover Bitrate | Main Trade-off |
|---|---|---|---|
| H.264 (AVC) | Baseline | About 4,800 kbps | Widest device and browser support |
| HEVC (H.265) | About 44% less | About 2,592 kbps | Hardware decode coverage varies by device |
| AV1 | About 55% less (about 20% less than HEVC) | About 2,064 kbps | Slower encoding; check device and browser support before using it as the default |
A six-content codec benchmark reported that, at approximately equal VMAF, HEVC required about 44% less bitrate than H.264, while AV1 required about 55% less than H.264 and roughly 20% less than HEVC. The same benchmark gives illustrative crossover bitrates of about 4,800 kbps for H.264, 2,592 kbps for HEVC, and 2,064 kbps for AV1. Those bitrates are content- and encoder-dependent. They are not a spec you can paste into every preset.
When a smaller file is not a win
AV1 or HEVC can cut delivery bandwidth and storage for a fixed perceptual target. That only helps if encode time is acceptable, the target phones and browsers can decode the file in hardware, and you have a fallback when they cannot. A file that looks excellent and fails to start on the device your buyers use is a failed export.
Efficiency also moves with the picture. For short-form social work, test five classes rather than one hero clip:
- Talking-head footage: faces and still backgrounds, where a modern codec often saves the most.
- Screen text: UI, code, and captions, where blur costs comprehension.
- Animation: flat color and hard edges.
- Low-light scenes: gradients that block early.
- Fast motion: sports, product spins, and quick cuts, where the saving shrinks.
Report bitrate, VMAF, encode time, file size, startup behavior, and playback success on each device in one row. Optimizing a single quality score can produce a technically efficient file that stalls, falls back, or looks wrong once it leaves the encoder.
Checking AI-Generated Footage Against Camera Footage
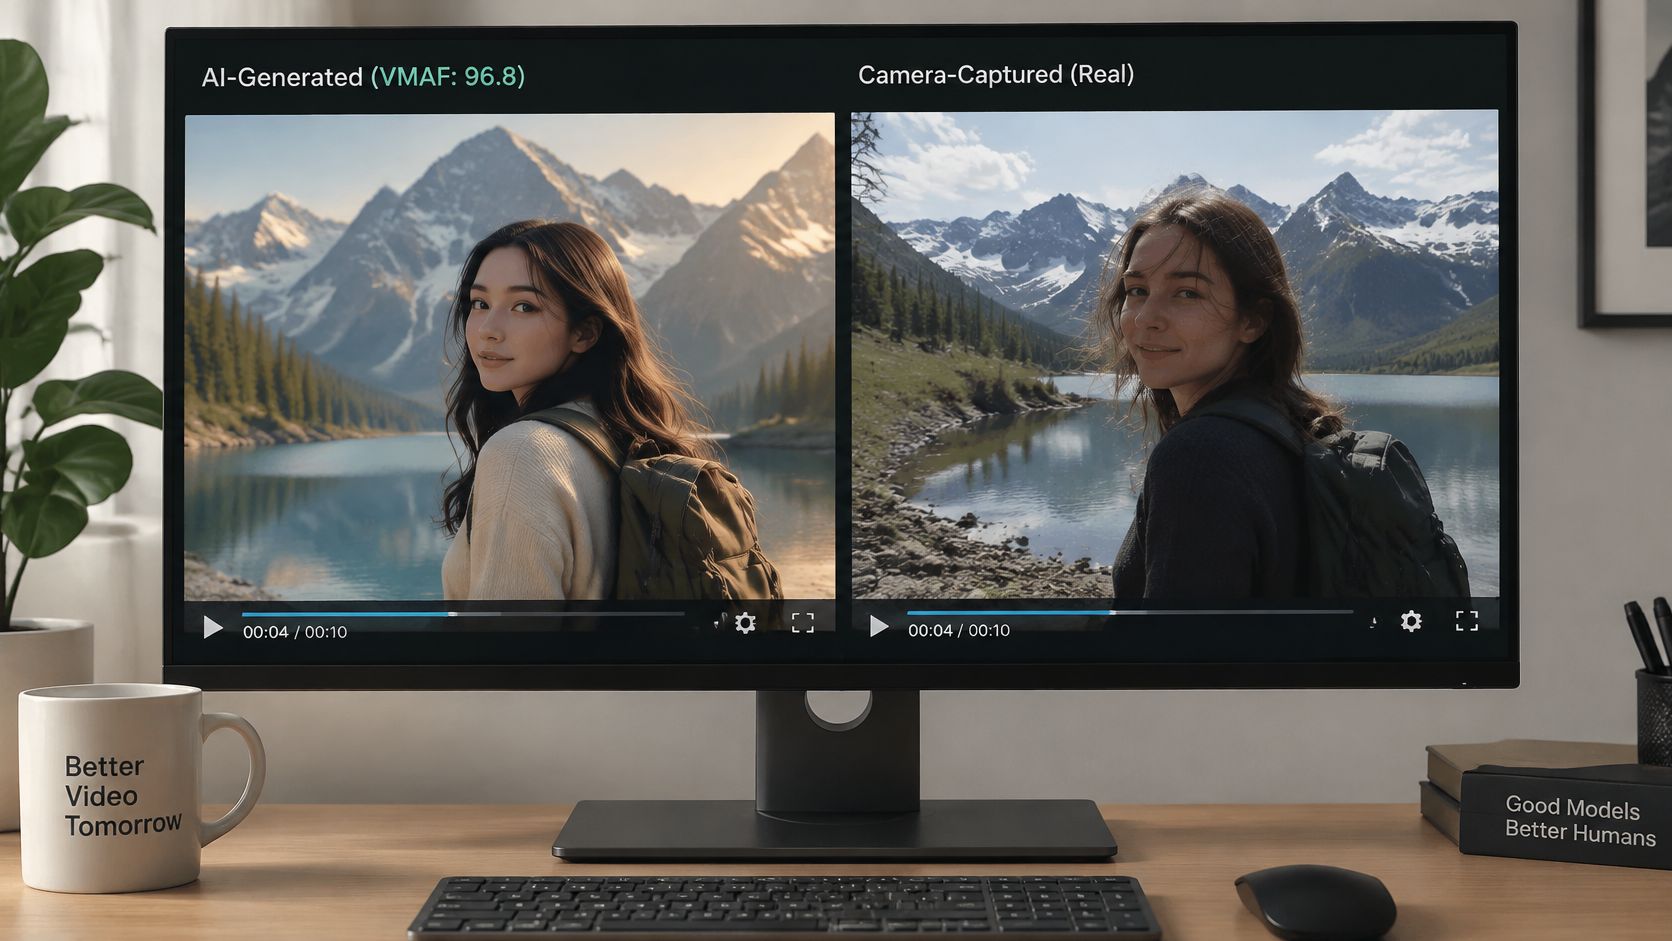
An AI clip can post a strong score and still look wrong. Hands morph, a sign melts, a mouth drifts off the voice. The metric compared pixels to a reference. It did not ask whether the scene is the scene you meant.
A human pass that a score will not do
Run these checks on the whole clip, not the opening frame:
- Temporal consistency. Look for flicker, morphing hands, and backgrounds that shift between frames.
- Facial detail from the first shot through the last, including profile turns.
- On-screen text, signs, and labels. If a word cannot be read, the shot fails even when the grade looks rich.
- Lip-sync against a generated or cloned voice. Watch plosives, not just the average mouth shape.
- Motion blur and fast pans. Smeared edges here are often where generated footage separates from a camera.
- Lighting continuity from cut to cut. A face that relights itself between angles reads as a different take.
Where you can, pair the AI clip with a camera clip of the same scene. Match resolution, frame rate, and bitrate on both exports so you are judging the footage, not the container. A short walkthrough of that kind of split view is here:
The gate that makes the two comparable
Accept the clip only when three things are true: a minimum mean VMAF, a minimum worst-scene VMAF, and a passed human review on the list above. The gate is the comparison. The average score is not.
Export Settings for Ads, Tutorials and Product Demos
Resolution without bitrate is a label. YouTube's upload specifications show the rate rising with both image size and motion. At 24, 25, or 30 fps, the guidance is about 8 Mbps for 1080p, 16 Mbps for 1440p, and 35 to 45 Mbps for 4K. At 48, 50, or 60 fps, those figures rise to 12 Mbps, 24 Mbps, and 53 to 68 Mbps. A 4K file under its bitrate can block, smear, or lose fine detail even with four times the pixel count of 1080p. Keep the upload frame rate the same as the recording frame rate.
| Use Case | Resolution and Frame Rate | Reference Bitrate | Codec and Container |
|---|---|---|---|
| Social ads (feed and vertical) | 1080p at 30 fps | About 8 Mbps | H.264 in MP4 |
| Tutorials and screen recordings | 1080p at the recording frame rate, usually 30 fps | About 8 Mbps; test higher if small text blurs | H.264 in MP4 |
| Product demos | 1080p at 24 or 30 fps; 4K only if the source is 4K | About 8 Mbps at 1080p; 35 to 45 Mbps at 4K | H.264 or HEVC in MP4 |
| Fast motion or high frame rate demos | 1080p at 60 fps | About 12 Mbps | H.264 in MP4 |
YouTube's encoding guidance supports an MP4 container with H.264 and notes that bitrate cannot be judged apart from the codec. For film-style sources, 24 or 25 fps progressive masters generally produce the best results, and at least 1920×1080 is the floor for video meant for sale or rental. Hold frame rate, codec, bitrate, and source still when you compare. Do not compare the words "HD" and "4K."
Stability on the network people actually have
Nominal resolution is a weak predictor of whether someone finishes the video. A 2025 study of streamed sports found that 18% of viewers reported poor streaming video quality. Among viewers aged 18 to 24, 31% cited freezing or buffering, 25% cited insufficient bandwidth for high-quality streaming, and 20% cited lag. Picture quality, how often quality switches, and rebuffer time drive the experience. On mobile, a steady 1080p export can beat an unstable 4K file. Log startup delay, rebuffer ratio, switch count, and time spent at the target size before you lock the preset.
Captions are a quality metric
A clean picture with bad captions still fails the job. A 2025 review of 36 peer-reviewed studies on social-media video captions, spanning accessibility, education, human-computer interaction, and language learning, shows caption use is a real research topic, not a finishing touch. Check accuracy, timing, line length on a small screen, speaker labels, and whether compression plus background noise wrecks speech. Translated audio that misses the mouth is the same class of failure.
The best export is the one that stays up and stays understandable for the people who will watch it. Pixel count is allowed to lose that argument.
Confirm Your Export Settings Before You Publish
A comparison score cannot approve an export on its own. The final file also has to match the intended settings, display readable captions, and play correctly on the devices your audience uses.
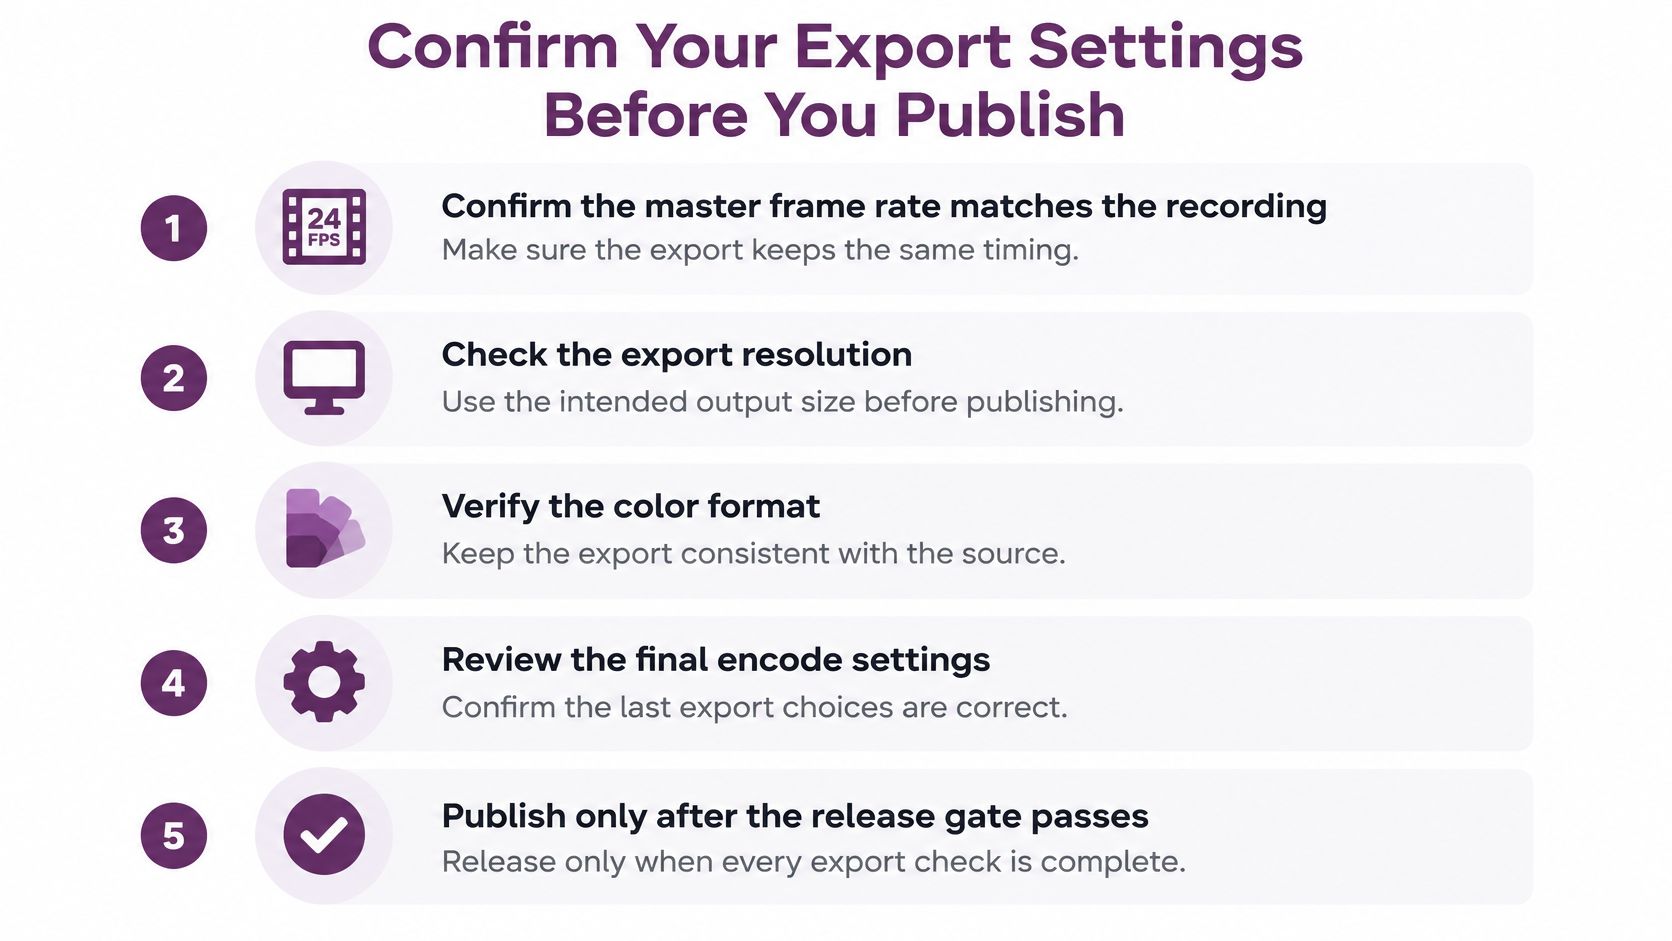
- Match the master frame rate to the recording and select the settings for this use case, rather than reusing an unrelated preset.
- Check codec, container and profile against the approved export settings.
- Compare the new export with the approved comparison sheet. Review both mean VMAF and the weakest scene; a strong average can hide a visible failure in one shot.
- Read the captions at phone size. Check timing, line breaks and speaker identification.
- Play the file on the device your audience uses most. Check for stalls and quality switches. For placement dimensions, use Adwave's guide to video sizes as a cross-check.
- Save the comparison sheet with the final file name, device and date so another reviewer can repeat the decision.
Use VMAF and the weakest scene to rank candidates, then review the result with viewers when the choice affects the final cut. Compare codecs at equal perceived quality, recording encode time and device playback alongside the score. A stable export with legible captions can serve its audience better than a higher-resolution file that plays poorly. Apply the same checks to image-to-video work that brings product shots, art and photos to life.
LunaBloom AI generates videos from text and images, with multilingual voiceovers, background music and customizable visuals. Before each video, the app shows the exact credit cost for its length, model and options, and customers pay only when the video finishes. To create a version for your next comparison, start with the free Starter plan: it includes two videos of up to 10 seconds each, with no monthly commitment.